The Configuration Performance Metrics Dialogs
Analyzing Configuration Performance
After you have created some configurations and optimized them, you'll need a way to objectively analyze and compare their performance. Although such performance metrics are shown during an optimization, that approach has some limitations.
Why Configuration Metrics Are Needed
You're probably familiar with optimization errors from the display in the Optimization Status tab of the Output window when the optimization is running. See the figure below for an example.
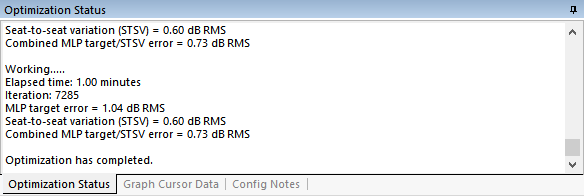
Error display during optimization is useful for determining when to stop the optimization and whether the results are satisfactory. But after an optimization is stopped and another is run, or if the project is closed, this error information would ordinarily be lost. The Configuration Performance Metrics dialogs allow you to see these errors and others at any time, for any configuration in the project, even before an optimization has been run on it.
About the Configuration Performance Metrics Dialogs
Configuration performance can be analyzed using two variants of the Configuration Performance Metrics dialog:
- the Multiple-Configuration Performance Metrics dialog.
- the Single-Configuration Performance Metrics dialog.
The Multiple-Configuration Performance Metrics dialog allows you to look at the performance metrics of all configurations you've optimized. It makes use of a configuration list that allows you to browse them.
This dialog contains three property pages.
- The Configuration Metrics property page shows numeric data for all errors that MSO calculates.
- The Calculation Options property page allows you to choose between using certain individually-chosen calculation options for each configuration's errors or a common set of options for calculating the errors of all configurations.
- The Configuration Graphs property page displays the graph that you have designated to be shown for the configuration currently selected in the configuration list.
The Single-Configuration Performance Metrics dialog consists of only a single property page, which is exactly the same as the Configuration Metrics property page of the Multiple-Configuration Performance Metrics dialog described above. For this reason, the documentation of this dialog just refers to that property page.
Launching the Single-Configuration Performance Metrics Dialog
There are multiple ways to invoke this dialog.
-
Choose the desired configuration directly from the Config View:
- Right-click on any configuration in the Config View and choose Performance Metrics for This from the context menu.
-
Choose the desired configuration from a configuration picker dialog:
- Press Ctrl+Shift+M.
- Choose Config, Performance Metrics for Chosen from the main menu.
- In the Config View, right-click on the topmost node and choose Performance Metrics for Chosen from the context menu.
- Right-click on any configuration in the Config View and choose Performance Metrics for Chosen from the context menu.
If you choose an option from the second group above, a dialog showing a list of configurations will be invoked as shown below.
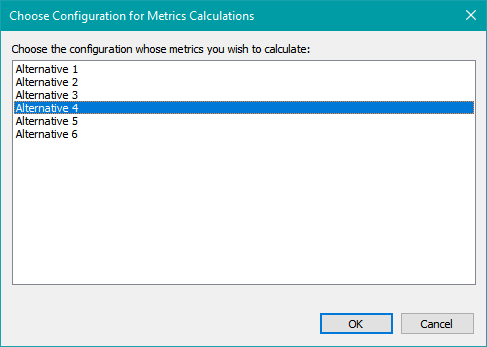
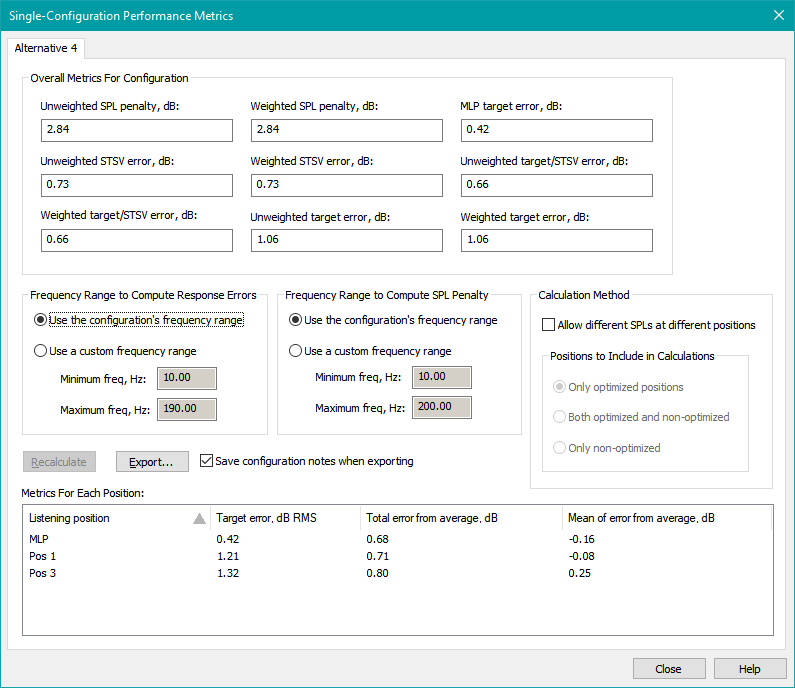
Select the desired configuration from the list and either double-click it, press Enter, or press the OK button. The Single-Configuration Performance Metrics dialog will then be launched. It is shown below.
Launching the Multiple-Configuration Performance Metrics Dialog
You can invoke this dialog in several ways.
- Press Ctrl+M.
- Choose Config, Performance Metrics for All from the main menu.
- Right-click on any configuration in the Config View and choose Performance Metrics for All from the context menu.
- In the Config View, right-click on the topmost node and choose Performance Metrics for All from the context menu.
The Multiple-Configuration Performance Metrics dialog will then be launched. Several images of this dialog are shown in the following sections.
Overview of the Multiple-Configuration Performance Metrics Dialog
When you launch the Multiple-Configuration Performance Metrics dialog, it initially appears as below.
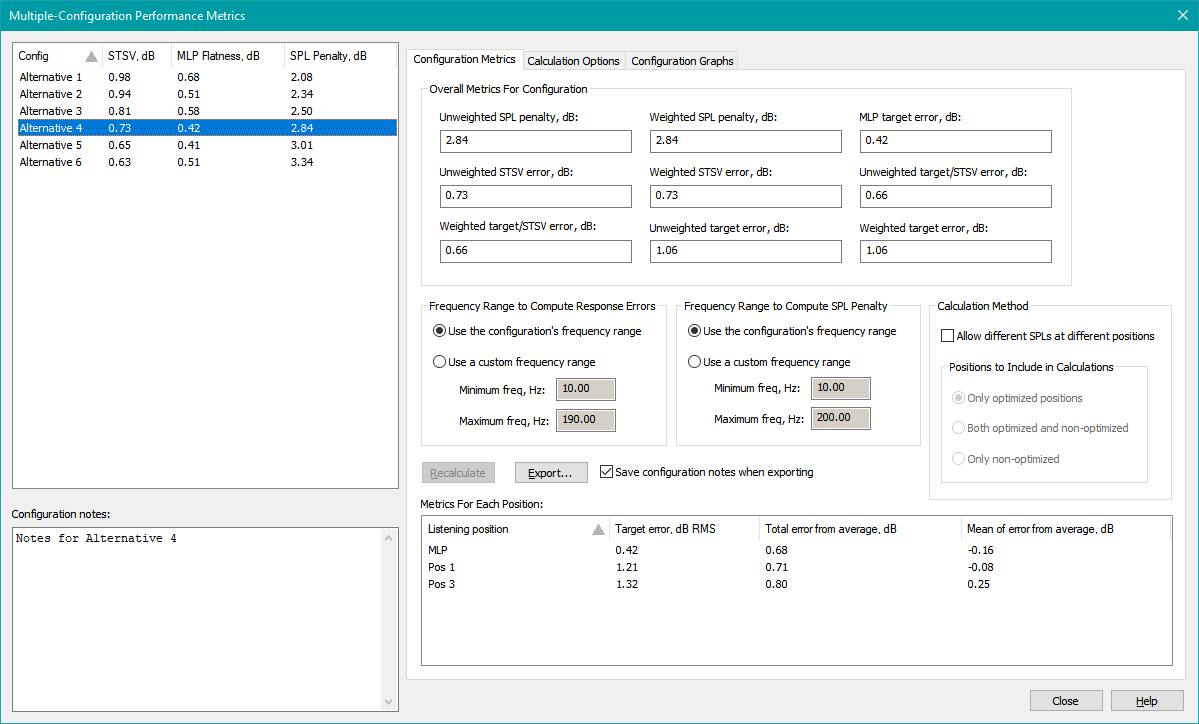
The Multiple-Configuration Performance Metrics dialog is resizable both horizontally and vertically. It consists of three major elements.
- the configuration list
- the text display of configuration notes
- an embedded property sheet containing three property pages
The Configuration List
This lists the configurations and the "big three" errors associated with each one. The list can be sorted in increasing or decreasing order by any of these errors and also alphabetically by configuration name. The "big three" errors will be explained in a subsequent topic below.
The Configuration Notes Text Display
As you change the selected configuration in the Configuration List using the up and down arrow keys, any Configuration Notes you may have entered will be displayed for the selected configuration in this text box.
The Embedded Property Sheet
The embedded property sheet has three property pages that were briefly introduced earlier. Each of these property sheets will be fully discussed in topics that follow below.
The Embedded Property Pages
Each embedded property page shows either performance metrics for the configuration selected in the Configuration List or calculation options for all configurations. These pages are described below.
The Configuration Metrics Property Page
The Configuration Metrics property page is shown below.
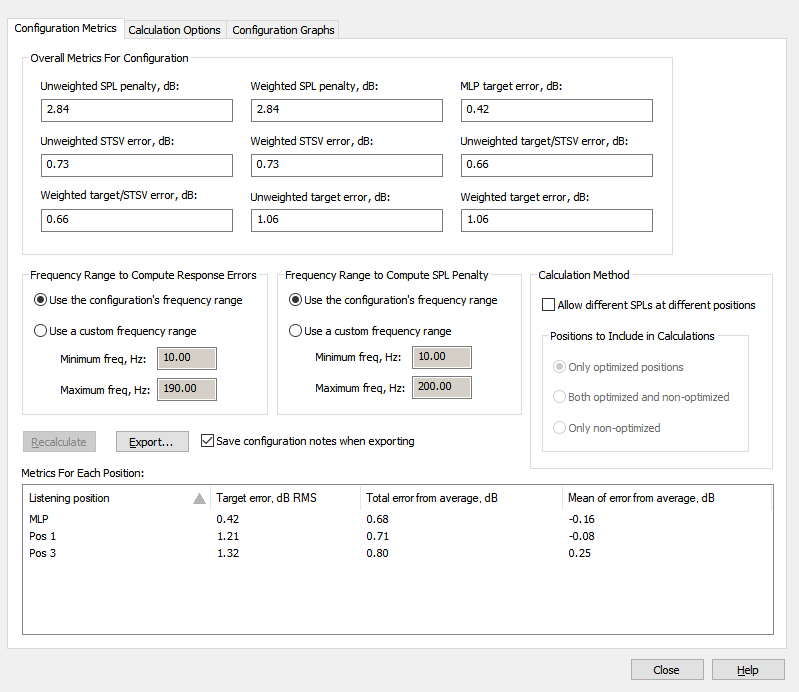
The controls of the Configuration Metrics property page are divided into control groups.
The Overall Metrics For Configuration Control Group
At the top left of the dialog is a collection of controls grouped within the Overall Metrics For Configuration group box. This group of controls displays nine different errors:
- Unweighted SPL penalty, dB
- Weighted SPL penalty, dB
- MLP target error, dB
- Unweighted STSV error, dB
- Weighted STSV error, dB
- Unweighted target/STSV error, dB
- Weighted target/STSV error, dB
- Unweighted target error, dB
- Weighted target error, dB
For the majority of situations, the "big three" errors indicated in the figure below are the major ones of interest.
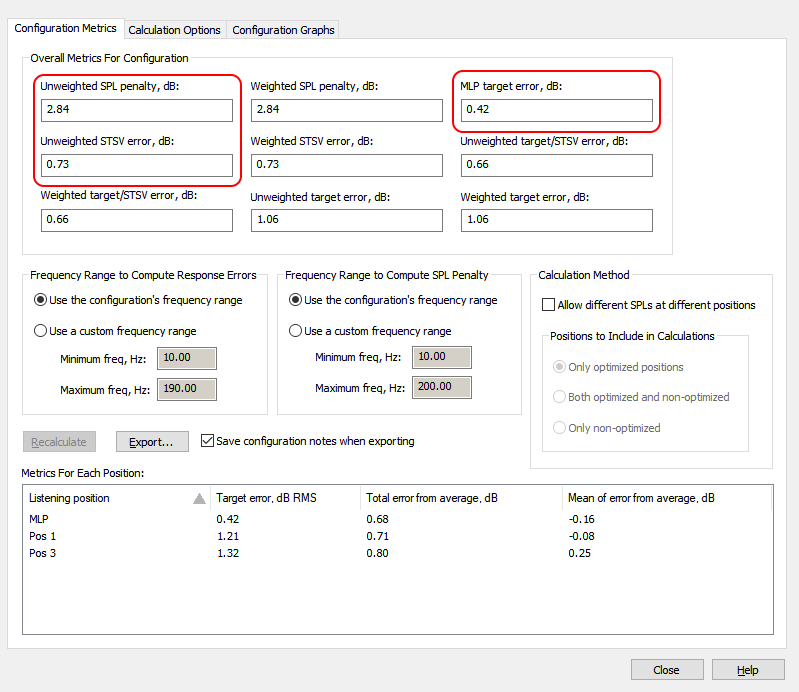
These are the same as the so-called "big three" errors shown in the Configuration List. This duplication is redundant when the Configuration Metrics property page is the current one. But if any other property page is active, the only way to see any error values is by looking at the Configuration List.
The details of all these errors are discussed below. These descriptions will make references to the How Optimization Errors are Calculated: the Details page, which has separate sections for Minimize seat-to-seat variations mode and As flat as possible without additional global EQ mode.
The Unweighted and Weighted SPL penalty, dB Edit Controls
The SPL penalty is a calculation for which details will be provided in the How Optimization Errors are Calculated: the Details page as time permits. Its value can only be zero in theory under a combination of two conditions.
- All DSP output channels must have identical transfer function magnitudes (gains, expressed in dB) at all frequencies.
- The acoustic pressure contributions of all subs must be in phase with one another at all frequencies and all listening positions.
The first item above is physically achievable, though it usually leads to high seat-to-seat variation (STSV) in practice. One might approximate the behavior described for the second item at a single listening position only, by using a large number of all-pass filters in each DSP output channel. However, getting all subs to be acoustically in phase with one another at all listening positions is an impossibility in practice. The purpose of the Maximize SPL using only delays and all-pass filters option in the Optimization Options dialog is to find the best possible approximation of the two ideal conditions above by meeting the first condition exactly, and getting as close as possible to the second condition using only delays and all-pass filters. When used as part of the multi-stage optimization, the value so achieved becomes the reference for how much SPL penalty degradation can be tolerated when optimizing later to minimize seat-to-seat variation.
The MLP target error, dB Edit Control
This error is a measure of how much the MLP response deviates from the target. If the MLP response perfectly matched the target, this error would be zero. A plot of the difference between the MLP response curve and the target curve is computed, and the RMS value of this difference is computed over frequency to yield this error value. Specifics of its computation are described in the Calculating the error of the MLP from the target section of the error calculation details page.
The Unweighted and Weighted STSV error, dB Edit Controls
This error is a measure of how much the responses at all the listening positions deviate from one another. If all the responses matched one another perfectly, this error would be zero regardless of the shape of the responses. Computation of this error is described in detail in the Calculating the average curve and seat-to-seat variation section of the error calculation details page.
MSO v2 added a weighting option to this calculation. By specifying Group Weights in the Optimization Options dialog and checking the option to use them, this error can be biased to favor lower errors at preferred listening positions.
The Unweighted and Weighted target/STSV error, dB Edit Controls
This error combines the MLP target error, dB and the unweighted or weighted STSV error, dB (as appropriate) together into one composite error. When the Minimize seat-to-seat variations (STSV) and flatten MLP response or Multi-stage: Maximize SPL, minimize STSV and flatten MLP response option is chosen in the Optimization Options dialog, the optimizer tries to minimize this combined error. Calculation of this error is described in the Calculating the total error section of the error calculation details page.
MSO v2 uses weighting in this calculation when weights and the option to use them are specified on the Group Weights page of the Optimization Options dialog.
The Unweighted and Weighted target error, dB Edit Controls
The last two errors - Unweighted target error, dB and Weighted target error, dB - refer to the errors calculated when the As flat as possible at all listening positions option is chosen on the Optimization Type property page of the Optimization Options property sheet. For these errors, the flatness errors at each listening position are combined in an RMS fashion into a single composite flatness error. That optimization option is left over from legacy MSO projects and is only used for unusual configurations.
For both of these calculations, the flatness error at each listening position is calculated as described in the Details of As Flat as Possible at All Listening Positions Mode section of the error calculation details page. The difference between the weighted and unweighted errors lies only in how the errors at each listening position are combined into a single error. This is described in The Distinction Between Unweighted and Weighted Flatness Errors Over Listening Position section of the error calculation details page. When error weights that aren't all equal are provided by the user, both the weighted and unweighted errors will be calculated, and will differ from one another. When no error weights are provided, the weighted error will be equal to the unweighted error.
The Frequency Range Control Groups
Just beneath the Overall Metrics For Configuration control group are two control groups for specifying the frequency ranges over which certain calculations are performed.
- Frequency Range to Compute Response Errors
- Frequency Range to Compute SPL Penalty
These two groups operate in an almost identical way, with the only difference being which frequency range they specify. They'll be discussed together here for that reason.
These two frequency ranges relate directly to the Frequency range to optimize response and Frequency range to optimize SPL items respectively on the General Options page of the Optimization Options property sheet as shown below.
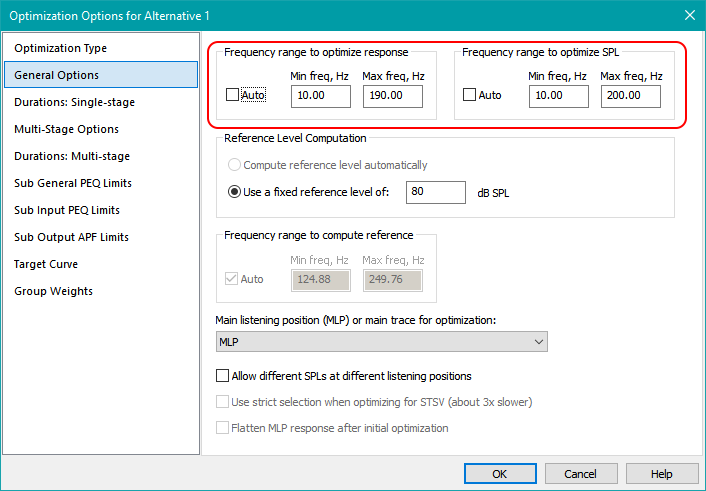
When you specify custom frequency ranges in the Performance Metrics dialog, the original ranges in the Optimization Options dialog above are not altered in any way. The custom frequency ranges of the Performance Metrics dialog just allow you to specify different values for error calculations than what was chosen for optimization in the Optimization Options.
Radio Buttons for Choosing Between Default and Custom Frequency Ranges
The radio buttons labeled Use the configuration's frequency range and Use a custom frequency range allow you to choose between default and custom frequency ranges over which the errors are calculated. When Use the configuration's frequency range is chosen, the optimization frequency range of the Optimization Options dialog shown directly above is used to compute the response errors. This range is stored in the configuration itself. When Use a custom frequency range is chosen, the frequency range over which the errors are computed is determined by the values you specify in the Minimum freq, Hz and Maximum freq, Hz edit controls.
Edit Controls for Specifying a Custom Frequency Range
The Minimum freq, Hz and Maximum freq, Hz edit controls allow you to specify the frequency range over which the errors are calculated when Use a custom frequency range option is selected. When this option is not selected, and instead the default selection of Use the configuration's frequency range is in effect, these controls display the default optimization frequency range stored in the configuration, and their contents are read-only. When the Use a custom frequency range option is in effect, editing of the custom frequency range values is enabled, and these controls display the custom frequency range.
The Recalculate Button
When editing of the Minimum freq, Hz or Maximum freq, Hz is in progress, MSO detects this situation and enables the Recalculate button. When you are done editing these values, click Recalculate to signal that editing is complete. This allows MSO to check the validity of the frequency values entered. Upon receiving valid frequency data, it computes the new errors. Whenever the Recalculate button is active and you're done editing, make sure to click it to ensure the error calculations are up to date.
Automatic Recalculation
When you toggle between the Use the configuration's frequency range and Use a custom frequency range options, MSO will automatically recalculate the errors for you. The Recalculate button is only needed when editing of the custom frequency values is in progress.
Why Choose a Custom Frequency Range?
A common application of the Configuration Performance Metrics dialog is to compare the performance of multiple configurations. But sometimes these different configurations arise from trying out different frequency ranges for optimization. In such cases, if you try to compare their errors using the default option of Use the optimization frequency range of the configuration, you'd be making the error comparison over different frequency ranges. These would not be fair comparisons. To correct this, specify Use a custom frequency range for all the configurations you're comparing, and set the frequency ranges to be identical for all of them. Then you'll be comparing the errors of the configurations in question over the same frequency range.
The Calculation Method Control Group
The Calculation Method control group allows you to specify how certain calculations are performed. Depending on how you set up your configuration, some controls may not be available.
The Allow different SPLs at different listening positions Checkbox
This checkbox should only rarely be checked. Its default state matches the state of the Allow different SPLs at different listening positions checkbox on the General Options property page of the Optimization Options property sheet. That checkbox is unchecked by default. Checking that checkbox is appropriate only in rare cases. One such case is when there are only front subs, and you wish to optimize the seat-to-seat variation in multiple seating rows. That would allow the rear rows to have an average SPL over frequency that's less than the front rows. In all other cases, that checkbox on the Optimization Options property sheet should be left unchecked. That means the corresponding checkbox on this property page will be left unchecked as well.
This checkbox is always available, regardless of how you set up the corresponding configuration. It affects how the unweighted and weighted STSV error, dB are calculated. When Allow different SPLs at different listening positions is checked, the unweighted and weighted STSV error, dB calculations ignore SPL differences between listening positions that are independent of frequency. When it is unchecked, such frequency-independent level differences are included in the error, usually making the error slightly larger.
In mathematical terms, when Allow different SPLs at different listening positions is checked, the STSV error, dB is a standard deviation calculation. When this option is unchecked, it is an RMS calculation.
The Listening Positions to Include in Calculations Control Group
The radio buttons of this control group are disabled for almost all configurations. If you have a configuration containing one or more plot-only measurement groups, these radio buttons will be enabled. This allows you to specify what role the plot-only measurement groups play in the error calculations of this dialog.
- Only optimized positions: Plot-only measurement groups play no role in the error calculations.
- Both optimized and non-optimized positions: All measurement groups, including plot-only ones, are included in the error calculations.
- Only non-optimized positions: Only the plot-only measurement groups are included in the error calculations.
If you have measured more listening positions than you have optimized, and you are curious about the various response errors at listening positions that aren't explicitly optimized, you can use these checkboxes to examine these errors calculated as above.
Errors Pertaining to Individual Listening Positions
The list view titled Metrics For Each Position lists errors associated with each listening position individually. The name of the listening position is given in the Listening position column on the left.
Target error, dB RMS
When the listening position in the left column corresponds to the MLP, the Target error, dB RMS corresponds exactly to the value in the MLP target error, dB RMS edit control, and its calculation is as described above for that item.
When the listening position is not the MLP, Target error, dB RMS refers to the RMS error of that position's frequency response from the target curve. This error is for information purposes and not used in the optimization itself.
Total Error and Mean of Errors From the Average
The two rightmost columns of the list view show statistics of the response at each listening position compared to the average curve. Computation of the average curve is described in the Calculating the average curve and seat-to-seat variation section of the error calculation details page. These errors are computed for each position as follows:
- At each frequency, subtract the average curve's dB SPL value from the dB SPL of the response at that position to form the raw error vs. frequency for that position.
- Compute the average value of the raw error over frequency. This value will appear in the rightmost column, Mean of error from ave, dB.
-
The following steps depend on whether or not the Allow different SPLs at different listening positions option is checked.
- If it is checked, at each frequency subtract the average value computed in step 2 above from the raw error described in step 1 above to form the shifted error (which will have zero mean over frequency after this operation).
- If it is unchecked, skip to step 4 below.
- Take the sum of the squares over frequency of the errors computed in step 3 above, divide this number by the number of frequencies, then take the square root. When the Allow different SPLs at different listening positions option is checked, this number will correspond to the standard deviation of the error from the average curve. When this option is unchecked, it will equal the RMS error. This number will appear in the Total error from average, dB column.
While these errors are not used by the optimizer, they might be useful for pointing out problematic listening positions.
Sorting the Errors in Each Column
The errors in any column can be sorted in increasing or decreasing order by clicking on the header of the list view's corresponding column. Sorting by the measurement group name in the left column is done alphabetically. When plot-only measurement groups are present in the configuration, the list rows containing such groups will be highlighted in a light gray color.
Exporting the Results to a Text File
You can save the results of all the calculations of this dialog to a text file by pressing the Export button.
Including Configuration Notes in the Exported Results
If you've entered configuration notes for the configuration whose performance metrics you're exporting, the Save configuration notes checkbox next to the Export button will be enabled. If this checkbox is checked when you press the Export button, these notes will be placed at the end of the exported data.
The Calculation Options Property Page
When the Calculation Options property page is activated, the Multiple-Configuration Performance Metrics dialog looks as follows.
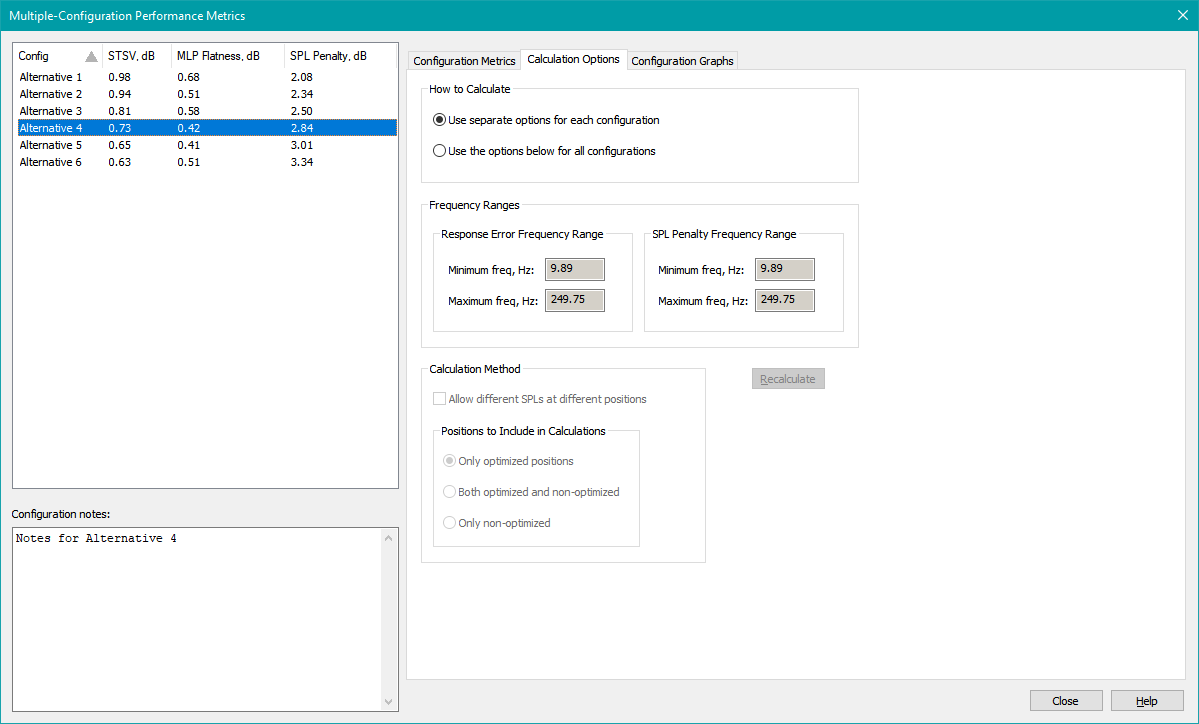
As with the Configuration Metrics property page, the controls of the Calculation Options property page are divided into several control groups.
The How to Calculate Control Group
This control group consists of two radio buttons:
- Selecting Use separate options for each configuration keeps the frequency range controls on the Configuration Metrics property page active, so that you can specify different frequency ranges for each configuration individually.
-
Selecting Use the options below for all configurations disables the frequency range controls on the Configuration Metrics property page and activates the Frequency Ranges controls on this property page. The newly-activated frequency range controls on this page will then set the calculation frequency ranges for all configurations at once.
- This avoids the tedious process of having to manually change the error calculation frequency ranges for each configuration individually should you want to compare them all under the exact same conditions.
The Frequency Ranges Control Group
When active, these frequency range controls operate exactly the same as the ones on the Configuration Metrics property page, except that the values you enter are applied to all configurations at once, rather than just the selected one.
The Recalculate Button
This button works identically to the one on the Configuration Metrics property page, except that when pressed, the errors of all configurations, not just the selected one, are recalculated. The updated error values will be shown right away in the configuration list, and on the Configuration Metrics property page when you switch to it.
Automatic Recalculation
When you toggle between the Use separate options for each configuration and Use the options below for all configurations options described above, MSO will automatically recalculate the errors of all configurations for you. The Recalculate button is only needed when editing of the custom frequency values is in progress. Recalculated error values are shown immediately in the configuration list, and on the Configuration Metrics property page after you switch to it.
The Calculation Method Control Group
This control group operates in exactly the same way as the corresponding one on the Configuration Metrics property page, except that the options are applied to all configurations rather than just the selected one.
The Configuration Graphs Property Page
When you activate the Configuration Graphs property page, the dialog box will look as in the image below.
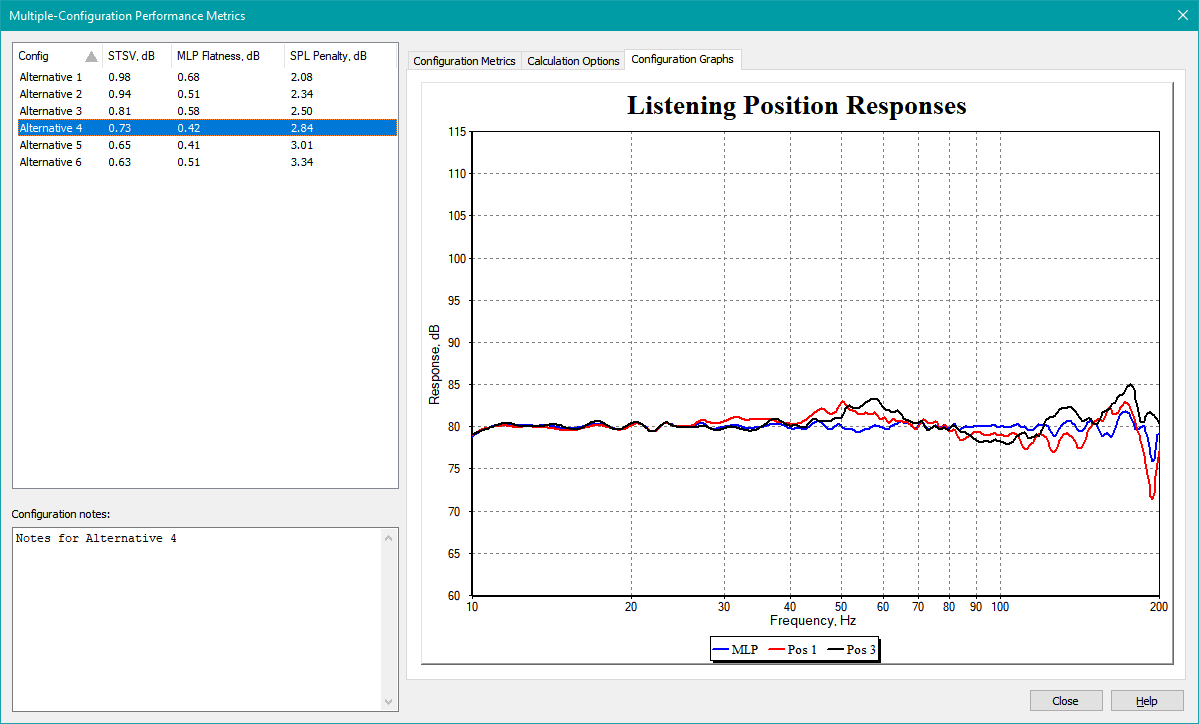
Activating this page gives you what amounts to a graph browsing capability. When you change the selected configuration in the configuration list, a graph for the currently selected configuration will be shown.
For best results, the graphs should be configured so that the limits of horizontal frequency axes and of the vertical dB SPL axes are all the same.
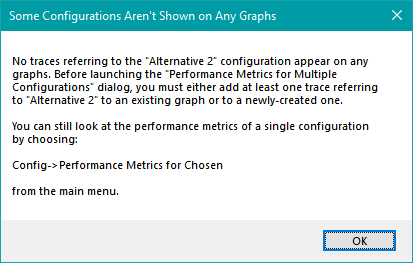
Which Graph Will Be Shown When You Select a Configuration?
Since many different graphs could be set up to display data belonging to a given configuration, how do you know which one of many possible graphs will be shown? The initial association of graphs with configuration is determined by an automated algorithm. However, if you have one or more configurations for which no data is shown on any graph, MSO won't launch the Multiple-Configuration Performance Metrics dialog. If you want to see the errors of any configuration under this condition, you'll need to launch the Single-Configuration Performance Metrics dialog instead. Attempting to launch the Multiple-Configuration Performance Metrics dialog in this situation will result in an error message dialog like the one shown below.
If all your configurations have data that is shown on some graph, but you wish to change which graph is shown in the graph browser, that can be changed easily in the Associate Graphs to Configurations dialog. That's the subject of the next section.