Section 4: Comparison Between Measured Data and New Models
Introduction
The procedures described in Section 3 were used to create new models for the MJL3281A and MJL1302A. The new models were used in the simulation setup of Figure 11, and the simulated fT vs. current, junction capacitances vs. reverse voltage, and β vs. current were evaluated and graphed. These data are shown in the next subsections.
Measured vs. Simulated Data and Comparison of Models - MJL3281A
fT vs. IC
Below in Figure 14 are the MJL3281A measured data of fT vs. IC and the corresponding simulated data. The measured data are shown in green. The simulated data are shown in blue for the newly-created SPICE model and red for the ON Semiconductor model. The solid lines are for VCE = 10 V and the dashed lines are for VCE = 5 V.
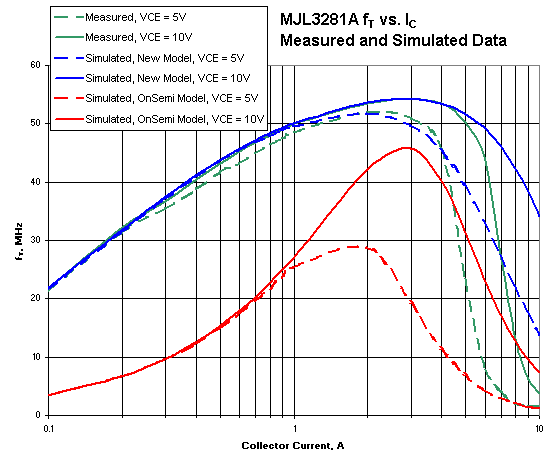
The simulated data of the new model corresponds very closely to the measured data for collector currents up to about 4A. Above this current value, the simulated data becomes progressively more optimistic. The improvements provided by the new model over the manufacturer-provided model are clearly seen.
Cob and Cib vs. Reverse Voltage
Figure 15 below shows the simulated and measured Cob and Cib data plotted against reverse voltage. Measured data are shown in green. Simulated data are shown in blue for the new model and in red for the manufacturer-provided model. Neither of the green traces is visible as the blue traces draw on top of them. See Figure 3 to verify the measured data.
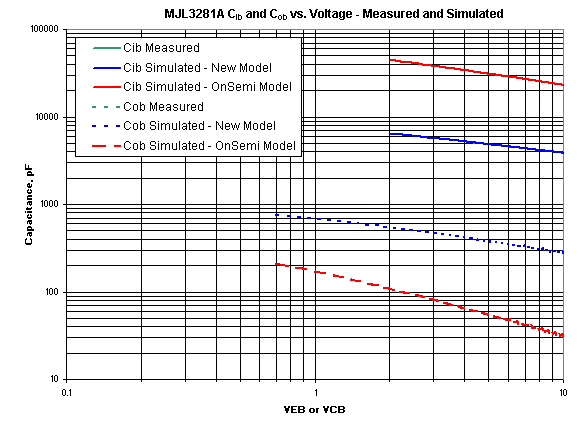
The simulated data is seen to be indistinguishable from the measured data for the new model.
β vs. Collector Current
The graph of Figure 16 shows measured and simulated data of β vs. collector current for the MJL3281A. Measured data are shown in green. Simulated data are shown in red for the manufacturer-supplied model and blue for the new model.
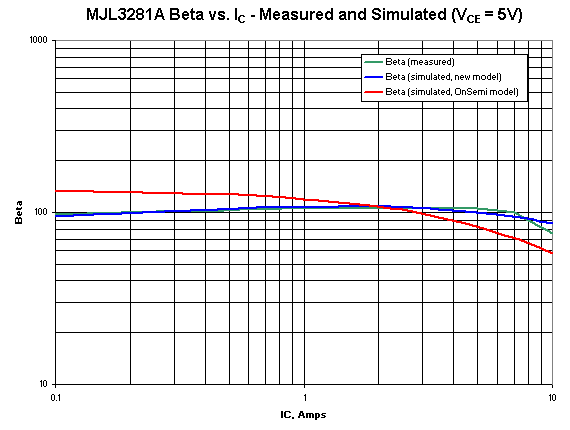
This graph shows an improvement in the accuracy of the simulated β in the new model over the manufacturer-provided model. The benefits of the optimization procedure of the previous section are clearly seen here. The form of the equation for collector current vs. VBE in the high-level injection region does not permit the modeling of the abrupt change in β that occurs above 7A however. Recall that only the knee of the curve of ln(IC) vs. VBE, and not its slope, can be specified. But by splitting the error evenly at high currents, close agreement between simulated and measured data can still be achieved.
Measured vs. Simulated Data and Comparison of Models - MJL1302A
fT vs. IC
Figure 17 below shows the measured and simulated fT vs. collector current data. Measured data are shown in green. Simulated data are shown in red for the manufacturer-provided model and blue for the new model. Data for VCE = 5 Volts are shown as dashed lines while solid lines depict the data for VCE = 10 Volts.

The new model shows improved tracking to the measured data throughout the low-current region. Measured and simulated data of the new model remain close at collector currents up to about 5A. Above that current level, the measured and simulated data diverge, with the simulated data becoming progressively more optimistic as current increases. Though the overall improvements are not as dramatic as for the MJL3281A, the areas of most improvement are at current levels where the device will be most often used in practice.
Cob and Cib vs. Reverse Voltage
Figure 18 shows the simulated and measured behavior of Cib and Cob vs. reverse voltage. Data for Cib are shown with solid lines, while the traces showing Cob data are dashed. Measured data are shown in green. Simulated data are shown in red for the ON Semiconductor model and in blue for the new model.
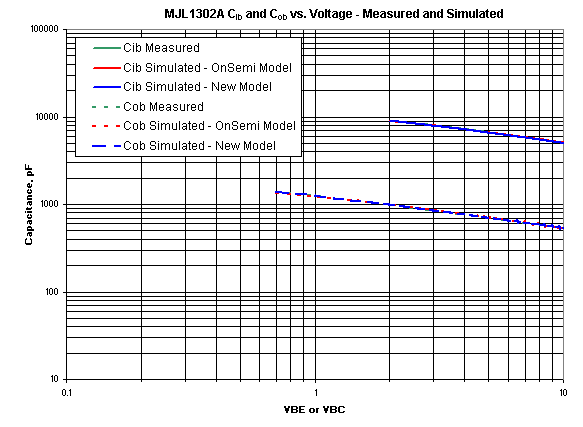
Note that both models have simulated data indistinguishable from the measured data. The new model introduces no real changes to the simulated data. The measured junction capacitance data were already matched very closely by the simulated data from the manufacturer-provided models. The simulated data were not compromised even though they were adjusted slightly in the case of Cib. That adjustment allowed more accurate simulations of fT vs. current in the low-current region as shown in Figure 17.
β vs. Collector Current
The plot of Figure 19 shows simulated and measured data of β vs. collector current for the MJL1302A. Measured data are shown in green. Simulated data are shown in blue for the new model and red for the ON Semiconductor model.
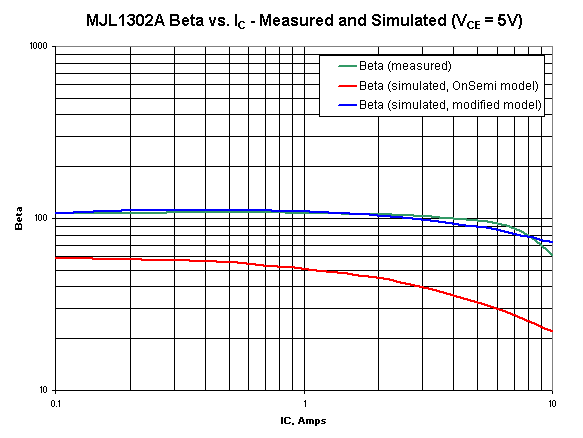
As with the MJL3281A, the new model improves the accuracy of the simulated β vs. current compared to the manufacturer-provided model. The optimization procedure of the previous section provides a substantial improvement in accuracy. Although the sharp reduction of β at currents above 5A cannot be simulated exactly due to the form of the model equations, the β error at high currents still remains small at collector currents up to 10A.
References
[1] Self, Douglas, Audio Power Amplifier Design Handbook (3rd. ed.), Newnes, 2002
[2] Massobrio, Giuseppe and Antognetti, Paolo, Semiconductor Device Modeling with SPICE (2nd. ed.), McGraw-Hill, 1998
[3] VBIC - Vertical Bipolar Intercompany Model Web Page - https://www.designers-guide.org/VBIC/index.html