Improving the Optimization Results
Open up the MSO project tutorial-new-2.msop that was saved earlier. We're going to rename the Config 1 configuration to Iteration 1, then clone it to a new configuration called Iteration 2, then modify the clone to try to get better results. These modifications to Iteration 2 will consist of the following:
- Increase the upper limit of the optimization frequency range from 160 Hz to 190 Hz.
- Allow each PEQ to have a boost of up to 3.0 dB, and constrain the total boost of all PEQs to a maximum of 3.1 dB.
- Add two more PEQs to each sub channel.
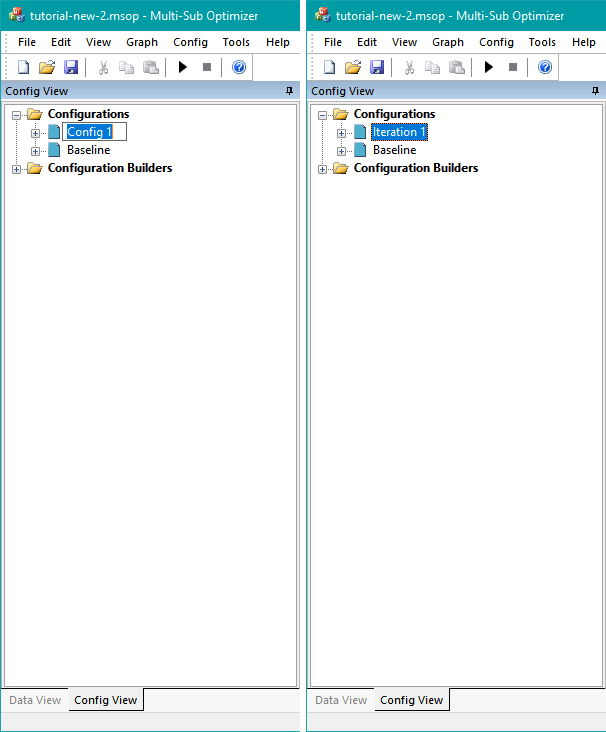
First, we rename Config 1 to Iteration 1 as below.
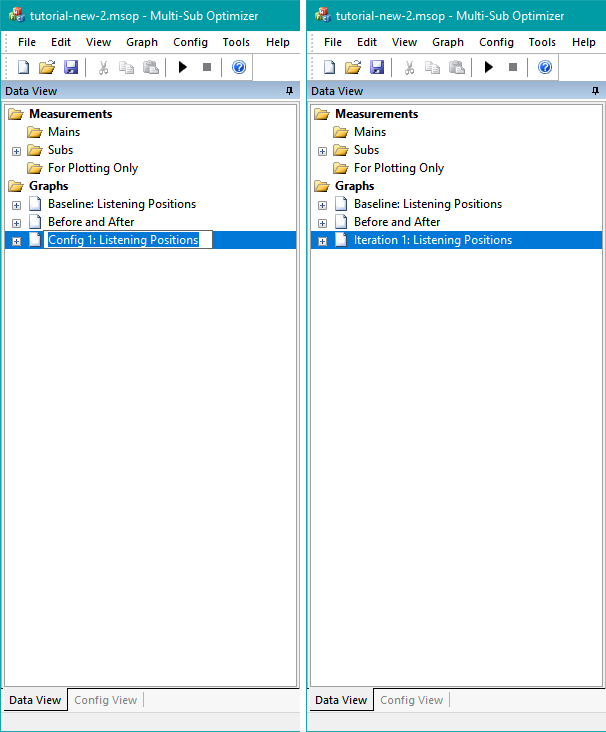
We'll need to rename the graph that was associated with Config 1 as well. This is shown below.
Cloning to a New Configuration
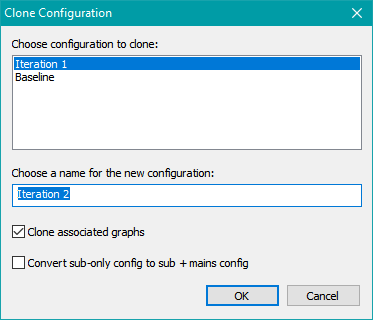
We'll now clone the Iteration 1 configuration to make Iteration 2. Select Config, Clone Configuration from the main menu and fill out the resulting dialog box as shown below.
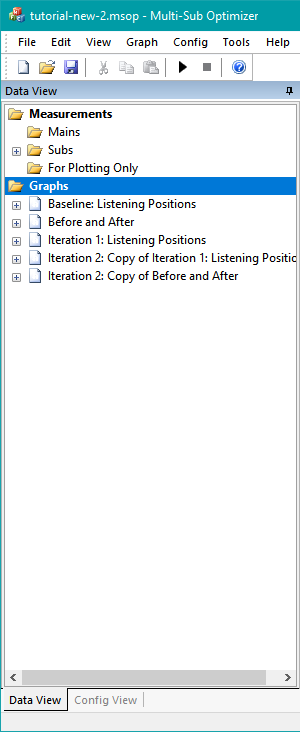
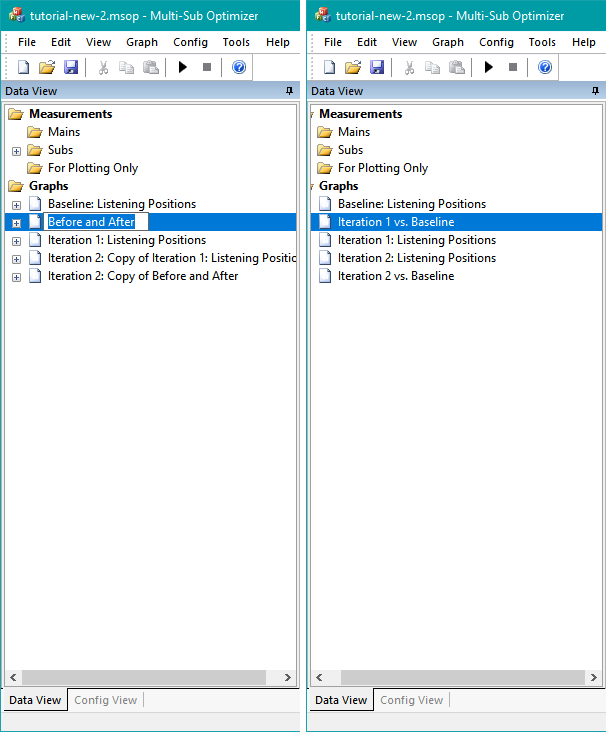
Click OK. When we look at the Data View, we see a confusing collection of graph names as shown below.
Renaming Graphs to Avoid Confusion
With three configurations, Before and After has lost meaning, as it's no longer clear what the reference is. Recall that we chose that name for a graph that compared data from what is now called Iteration 1 to the data of Baseline. So let's rename it to Iteration 1 vs. Baseline. Likewise, let's rename Iteration 2: Copy of Iteration 1: Listening Positions, giving it the new name of Iteration 2: Listening Positions. Finally, we'll rename Iteration 2: Copy of Before and After to Iteration 2 vs. Baseline. The graph names before and after this renaming operation are shown below.
It's worth noting what happens to the graphs when you clone a configuration. Suppose we were to clone a configuration named Config-Orig to a new one named Config-New. When you do this, MSO looks through every graph in the project to see if it has any traces referring to Config-Orig. For each graph it finds, it copies that graph, including all options and all traces, then replaces all traces having references to Config-Orig with traces referencing Config-New. That's why Iteration 2: Copy of Before and After above became Iteration 2 vs. Baseline. The Baseline traces of the original graph were left alone in the new graph, and the traces referring to data from Iteration 1 were changed to refer to Iteration 2. This is useful, but you have to be careful with the graph naming as we did above, making sure that the name of any graph accurately reflects the data it's showing.
Fixing Up the Optimization Options of the Iteration 2 Configuraion
We're now ready to do the first two tasks listed above. These can be done using the Optimization Options property sheet. There are two ways to launch this property sheet. The first is to select Tools, Optimization Options from the main menu. This gives you the property sheet shown below.
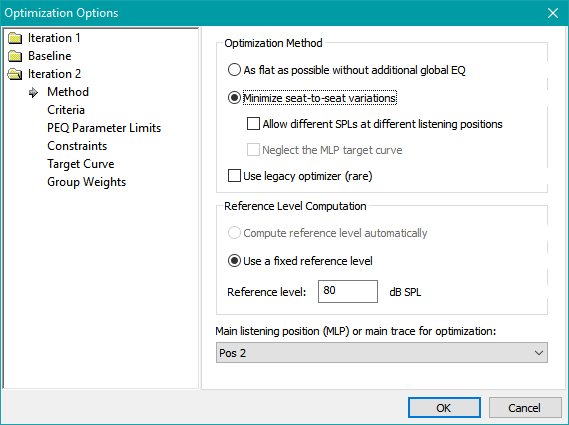
Notice that this property sheet looks a little different from the one launched by the wizard. This version of the Optimization Options property sheet can be used to alter the optimization options of all the configurations in the project. Using the tree view on the left, you first pick the configuration whose options you want to change. Then you can go through all the property pages for that configuration as needed.
The other way of launching the Optimization Options property sheet is by going to the Config View and right-clicking the topmost node of the configuration whose options you want to change, then choosing Optimization Options... from the context menu. This launches the Optimization Options property sheet, as shown on the right side of the figure below.
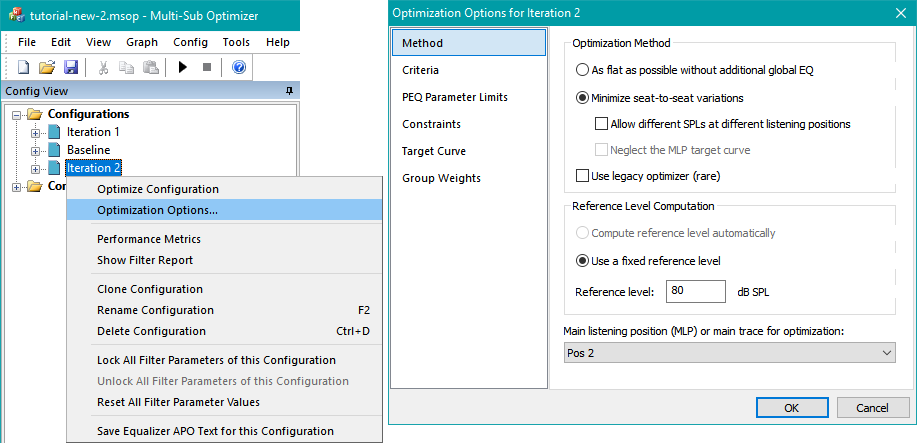
Using this property sheet reduces the risk of accidentally changing the optimization options of the wrong configuration, especially since its title bar displays the name of the configuration whose options you're modifying. We'll use this version of the Optimization Options property sheet in the discussion that follows.
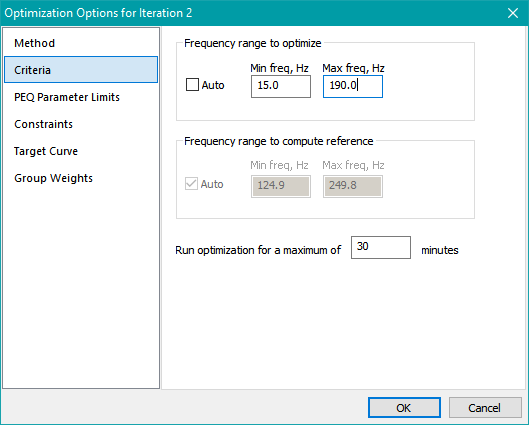
Launch the configuration-specific Optimization Options property sheet for the Iteration 2 configuration as shown in the figure above. Select the Criteria property page as shown below, and set the maximum frequency of optimization to 190 Hz. The figure below shows what the result should look like.
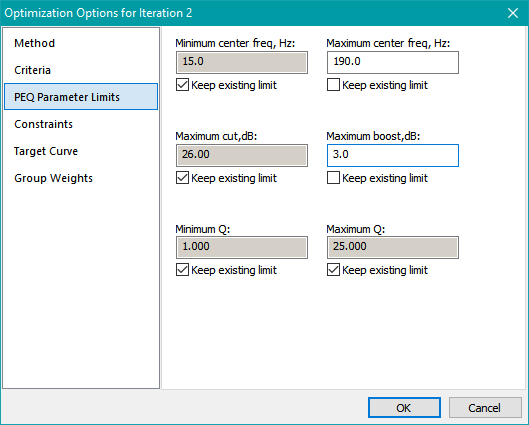
Now select PEQ Parameter Limits. Uncheck Keep existing limit under the Maximum center frequency, Hz: edit control. We want this upper limit to be the same as the upper limit of the optimization frequency range that we just changed. Set this upper limit to 190 Hz. Uncheck Keep existing limit under the Maximum boost, dB: edit control and set the maximum boost to 3.0 dB. This property page should look like the figure below when you're done.
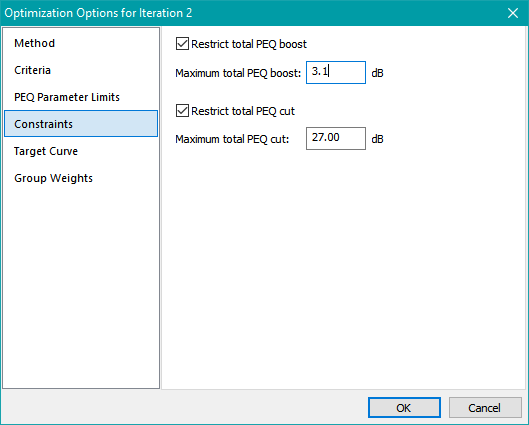
Select the Constraints property page. Check the Restrict total PEQ boost checkbox, and specify 3.1 dB for the maximum value as shown in the figure below.
Click OK. Since we've just increased the maximum optimization frequency so that the optimization frequency range now includes a region having rough frequency responses needing more correction (because the new range includes more room modes), we'll need to increase the number of PEQs per sub. We'll add two more PEQs in each sub channel.
In this tutorial, we've depended on using the wizard to generate the first configuration, then used configuration cloning to generate the second and subsequent ones. Modification of existing configurations has only been done using the Optimization Options property sheet. This is the most efficient way to create and modify configurations. But now we must modify an existing configuration by adding two PEQ filters to each subwoofer channel, which can't be done using the Optimization Options property sheet. In order to understand the changes to be made, it's now necessary to take a bit of a side trip, and describe how configurations are structured. That's the topic of the next section.